We at StockMarket Trivia believes in Long Term Investment potential of Indian Stock Market so with this belief we have started offering Stock Market Advisory service with product Portfolio ranging from.. 1.Fundamental & Technical Stock Advisory 2.Portfolio Advisory Service 3.Mutual Fund Advisory 4.Life Insurance(SBI Life) 5.Health Insurance(MaxBupa), many more services to come...
Tuesday, 8 June 2021
DILIP BUILDCON LTD-SUPERTREND BREAKOUT
Thursday, 22 April 2021
HIKAL WEEKLY HEAD & SHOULDER PATTERN
TECHNICAL DESK CALL
HIKAL
STRONG BUY RANGE 201---196
STOPLOSS 174
TARGET 220 --- 240 --- 260
RATIONAL :
➤HEAD & SHOULDER PATTERN BREAKOUT ON WEEKLY CHART
➤STRONG ABOVE AVERAGE VOLUME ON DAILY CHART
➤MULTI YEAR HIGH ABOVE 200
Thursday, 4 March 2021
PHILIPCARB- PARALLEL CHANNEL BREAKOUT
Monday, 22 February 2021
MINDACORP- PRICE ACTION VOLUME BREAKOUT
SHORT TERM DELIVERY
MINDACORP
STRONG BUY RANGE 102 --- 96
STOPLOSS 87
TARGET 110 --- 120
RATIONAL :
➤ PRICE VOLUME BREAKOUT ON DAILY CHART
➤ RSI ABOVE 60 SUGGEST BUYING MOMENTUM
➤ MULTI MONTH BREAKOUT ABOVE 100 AFTER MARCH 2020
Tuesday, 16 February 2021
ABCAPITAL- CUP & HANDLE PATTERN
SHORT TERM DELIVERY
ABCAPITAL
STRONG BUY ABOVE 96 --- 92(AVG)
STOPLOSS 79
TARGET 115 --- 123 --- 143
LONG TERM TARGET : 240 (1YRS) 440 (3YRS) CAN BE MULTIBAGGER PORTFOLIO STOCK
RATIONAL :
➤ CUP & HANDLE PATTERN BREAKOUT ABOVE 96
➤ VWAP BREAKOUT ON DAILY CHART
➤ DOWNWARD SLOPPING TRENDLINE BREAKOUT
Monday, 15 February 2021
MAHINDCIE ASCENDING TRIANGLE PATTERN
SHORT TERM DELIVERY
MAHINDCIE
STRONG BUY RANGE 182 --- 176
STOPLOSS 162
TARGET 196 --- 204 --- 225
RATIONAL :
👉 VWAP BREAKOUT ABOVE 182
👉 ASCENDING TRIANGLE PATTERN BREAKOUT
👉 RSI BREAKOUT ABOVE 50% MEDIUM RANGE
👉 MULTI MONTH BREAKOUT AFTER HUGE CONSOLIDATION
Friday, 15 January 2021
IDEA WEEKLY CHART BREAKOUT
SHORT TERM DELIVERY CALL
VODAFONE-IDEA
STRONG BUY RANGE 13 --- 11
STOPLOSS CLB 9
SHORT TERM TARGET 18 --- 20
MEDIUM TERM TARGET 25 --- 30 (6 MONTHS)
LONG TERM TARGET 40 (2YRS)
TECHNICAL WEEKLY CHART MULTI MONTHS BREAKOUT
Wednesday, 6 January 2021
PRSMJOHNSN PRICE-VOLUME BREAKOUT DAILY CHART
SHORT TERM DELIVERY CALL
PRSMJOHNSN LTD
STRONG BUY RANGE 90 --- 87 --- 82
STOPLOSS 68
SHORT TERM TARGET 102 --- 112 --- 124
LONG TERM TARGET 145 --- 225 (1YRS) --- 425 (2YRS)
TECHNICAL CHART : PRICE - VOLUME BREAKOUT
Wednesday, 16 December 2020
IBREALEST DAILY CHART ANALYSIS
SHORT TERM DELIVERY CALL
IBREALEST LIMITED
STRONG BUY RANGE 78 --- 72
STOPLOSS 54
TARGET RANGE 90 --- 108
TIMEFRAME : 8 WEEKS
TECHNICAL CHART : ROUND PATTERN BREAKOUT
Wednesday, 9 December 2020
OLECTRA DAILY CHART ANALYSIS
SHORT TERM DELIVERY CALL
OLECTRA GREENTECH LTD
STRONG BUY RANGE 103 --- 96 --- 87
STOPLOSS 75
TARGET RANGE 124 --- 146
TIMEFRAME : 8 WEEKS
TECHNICAL CHART - FIBONACCI RETRACEMENT
Tuesday, 1 December 2020
TATACOFFEE Daily Chart Analysis
Short Term Delivery Call
TATACOFFEE Strong Buy Range 105 --- 101
Stoploss 98
Target Range 110 --- 115 --- 120
Time Frame - 21days
Saturday, 21 November 2020
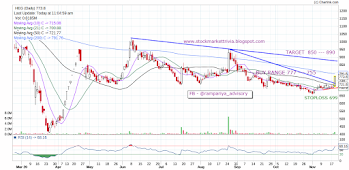
HEG Daily Chart Analysis
Short Term Delivery Call
HEG Strong Buy Range 777 --- 755
Stoploss 699
Target Range 850 --- 890 --- 950
Time Frame : 8 weeks
Tuesday, 4 December 2018
GoaCarbon Daily Chart Analysis
Short Term Deliver Call
GoaCarbon Strong Buy Above 530 Stoploss 510 Target 580---625
Graphical Presentation :
Technical Presentation :
Tuesday, 3 July 2018
ONGC Daily Chart Analysis
Short Term Delivery Call
ONGC Strong Buy Above 161 Stoploss 149 Target 167---175---190
Graphical Presentation :
Technical Presentation :
Sunday, 31 December 2017
IBVENTURE daily Chart Analysis
Short Term Delivery Call
Graphical Presentation :
Technical Presentation :
Monday, 31 July 2017
Cochin Shipyard IPO: Apply or Ignore?

Background:

Business & Clients:
- The company undertakes both defence and commercial orders
- Defence accounts for nearly 80% of the revenues
- Shipbuilding makes up ~ 80% of the revenues and the balance 20% comes from ship repairs
- Indian Navy and Indian Coast Guards make up 85% of the revenues
- The company is building India’s first IAC (Indigenous Aircraft Carrier)
Future Prospects:

Financials:

- The company has grown its revenues at a CAGR of 7.95% between FY12 and FY17
- The company has grown its PAT at a CAGR of 15.75% between FY12 and FY17
- The company has demonstrated pricing power by expanding margins
- Other income makes up nearly 1/3rd of the EPS
Valuations:
Apply or Ignore:
Disclaimer : Source - www.raghavbehani.com
Friday, 24 February 2017
Avenue Supermart (D-Mart) IPO Analysis
D-Mart IPO- King of Retail
Tuesday, 27 December 2016
RSSOFTWARE WEEKLY CHART
STRONG BUY RSSOFTWARE above 96 STOPLOSS 70 TARGET 150---200 (PURELY DELIVERY)
GRAPHICAL PRESENTATION:
TECHNICAL PRESENTATION:
Since start of the year 2015 stock has corrected from 300 level to low of 58 level in mid Jan 2016 where the counter has find some support level and from last 11 month the counter is consolidating in the price rage of 60 to 100 level. Further, the RSI Oscillator on weekly chart is indicating positive divergence from start of November month which is also coincide with MACD parameter too. So considering the above technical parameter on weekly chart we are advising our clients/Traders/Investors to but the stock after due diligence.
TVS ELECTRONICS LTD DAILY CHART
BUY TVSELECT ABOVE 176 STOPLOSS 150 TARGET 250---300 (PURELY DELIVERY )
GRAPHICAL PRESENTATION:
TECHNICAL PRESENTATION:
On daily chart, recently stock has given a sharp rally from 100 to 231 within just 14 trading session which is spectacular gain in-spite of market under performance due to demonetisation by Modi led NDA government. so if we draw an Retracement from 100 to 231 level, after touching recent new high now the stock is in profit booking mood and has taken an support at 38% retracement level which coincide at 177 on close basis. Thus we are again advising our clients to reenter if they have missed first upmove rally in this counter.
Friday, 11 November 2016
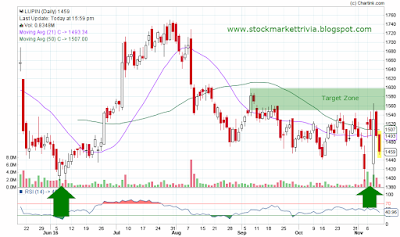
LUPIN DAILY CHART
Graphical Presentation:
 |


