expr:class='"loading" + data:blog.mobileClass'> badge
Showing posts with label Technical Desk Call. Show all posts

Friday, 27 August 2021

HAPPIEST MINDS- FLAG & POLE PATTERN

SHORT TERM DELIVERY

HAPPSTMNDS

STRONG BUY ABOVE 1475 CB

STOPLOSS  1310

TARGET  1575---1650---1780


RATIONAL :

➤ FLAG & POLE PATTERN

➤ ACCUMULATION ON DAILY CHART

➤ RSI ABOVE 60 INDICATES BULLISH MOMENTUM

Tuesday, 8 June 2021

DILIP BUILDCON LTD-SUPERTREND BREAKOUT

SHORT TERM DELIVERY

DILIP BUILDCON LTD

STRONG BUY RANGE 575 --- 565

STOPLOSS  545

TARGET  600 --- 640


RATIONAL :
➤ SUPERTREND BREAKOUT ABOVE 580 DAILY CHART
➤ RSI ABOVE 60 INDICATE BULLISH TREND
➤ 89 DMA SUPPORT AT 550 

Thursday, 22 April 2021

HIKAL WEEKLY HEAD & SHOULDER PATTERN

TECHNICAL DESK CALL

HIKAL 

STRONG BUY RANGE  201---196

STOPLOSS  174

TARGET  220 --- 240 --- 260


RATIONAL : 

➤HEAD & SHOULDER PATTERN BREAKOUT ON WEEKLY CHART

➤STRONG ABOVE AVERAGE VOLUME ON DAILY CHART

➤MULTI YEAR HIGH ABOVE 200 

Thursday, 4 March 2021

PHILIPCARB- PARALLEL CHANNEL BREAKOUT

TECHNICAL DESK CALL 

PHILIPCARB

STRONG BUY RANGE   212 --- 208

STOPLOSS  189

TARGET  240 --- 260

RATIONAL :
⏩ PARALLEL CHANNEL BREAKOUT
⏩ 89EMA SUPPORT 
⏩ PRICE VOLUME ACTION ABOVE 212 (CLS)
⏩ V SHAPE RECOVERY BREAKOUT ABOVE 185 (CLS)

Monday, 22 February 2021

MINDACORP- PRICE ACTION VOLUME BREAKOUT

SHORT TERM DELIVERY

MINDACORP

STRONG BUY RANGE  102 --- 96

STOPLOSS  87

TARGET  110 --- 120


RATIONAL :

➤ PRICE VOLUME BREAKOUT ON DAILY CHART

➤ RSI ABOVE 60 SUGGEST BUYING MOMENTUM

➤ MULTI MONTH BREAKOUT ABOVE 100 AFTER MARCH 2020


Tuesday, 16 February 2021

ABCAPITAL- CUP & HANDLE PATTERN

 SHORT TERM DELIVERY

ABCAPITAL  

STRONG BUY ABOVE 96 --- 92(AVG)

STOPLOSS  79

TARGET  115 --- 123 --- 143

LONG TERM TARGET : 240 (1YRS) 440 (3YRS) CAN BE MULTIBAGGER PORTFOLIO STOCK


RATIONAL :

➤ CUP & HANDLE PATTERN BREAKOUT ABOVE 96

➤ VWAP BREAKOUT ON DAILY CHART

➤ DOWNWARD SLOPPING TRENDLINE BREAKOUT

Monday, 15 February 2021

MAHINDCIE ASCENDING TRIANGLE PATTERN

SHORT TERM DELIVERY

MAHINDCIE

STRONG BUY RANGE  182 --- 176

STOPLOSS  162

TARGET   196 --- 204 --- 225


RATIONAL :

👉 VWAP BREAKOUT ABOVE 182
👉 ASCENDING TRIANGLE PATTERN BREAKOUT 
👉 RSI BREAKOUT ABOVE 50% MEDIUM RANGE
👉 MULTI MONTH BREAKOUT AFTER HUGE CONSOLIDATION

Friday, 15 January 2021

IDEA WEEKLY CHART BREAKOUT

SHORT TERM DELIVERY CALL

VODAFONE-IDEA

STRONG BUY RANGE  13 --- 11

STOPLOSS CLB  9

SHORT TERM TARGET 18 --- 20

MEDIUM TERM TARGET 25 --- 30 (6 MONTHS)

LONG TERM TARGET  40 (2YRS)

TECHNICAL WEEKLY CHART MULTI MONTHS BREAKOUT


Wednesday, 6 January 2021

PRSMJOHNSN PRICE-VOLUME BREAKOUT DAILY CHART

SHORT TERM DELIVERY CALL
PRSMJOHNSN LTD

STRONG BUY RANGE  90 --- 87 --- 82

STOPLOSS   68

SHORT TERM TARGET  102 --- 112 --- 124

LONG TERM TARGET    145 --- 225 (1YRS) --- 425 (2YRS)

TECHNICAL CHART : PRICE - VOLUME BREAKOUT  


Wednesday, 16 December 2020

IBREALEST DAILY CHART ANALYSIS

SHORT TERM DELIVERY CALL

IBREALEST LIMITED

STRONG BUY RANGE  78 --- 72

STOPLOSS   54

TARGET RANGE  90 --- 108

TIMEFRAME  : 8 WEEKS


TECHNICAL CHART : ROUND PATTERN BREAKOUT


Wednesday, 9 December 2020

OLECTRA DAILY CHART ANALYSIS

SHORT TERM DELIVERY CALL

OLECTRA GREENTECH LTD

STRONG BUY RANGE  103 --- 96 --- 87

STOPLOSS  75

TARGET RANGE  124 --- 146

TIMEFRAME : 8 WEEKS


TECHNICAL CHART - FIBONACCI RETRACEMENT


Tuesday, 1 December 2020

TATACOFFEE Daily Chart Analysis

Short Term Delivery Call

TATACOFFEE Strong Buy Range 105 --- 101

Stoploss  98

Target Range 110 --- 115 --- 120

Time Frame - 21days


Tuesday, 3 July 2018

ONGC Daily Chart Analysis

Short Term Delivery Call


ONGC Strong Buy Above 161 Stoploss 149 Target 167---175---190


Graphical Presentation :


ongc daily chart analysis


Technical Presentation : 

On Daily chart the counter had been in a very deep correction from january 2018 till date. If we draw a fibonacci Retracement from recent low of 151.80 (52W Low) to recent top of 212 (52W High) than 38% retracement come at 175 which should be touch in coming days as per the study if it hold the low price. Also the counter has today tried to breakout from downward trendline resistance of 161 but it got failed to give close above it but looking to today's volume we can presume that in coming days it should resume its upward movement and should give bounce back to our suggested target zone.

Sunday, 31 December 2017

IBVENTURE daily Chart Analysis

Short Term Delivery Call


IBVENTURE 

Strong Buy Above 410  Stoploss 389  Target 425---445---515

Graphical Presentation : 

ibventure daily chart analysis


Technical Presentation : 

On Daily chart the counter had been in a very deep correction from September 2018 till date. If we draw a Fibonacci Retracement from recent low of 324 to recent top of 819 than 38% Retracement come at 513 which should be touch in coming days as per the study if it hold the low price. Also the counter has recently this week tried to breakout from bottom level with increase in volume so we can presume that in coming days it should resume its upward movement and should give bounce back to our suggested target zone.

Tuesday, 27 December 2016

RSSOFTWARE WEEKLY CHART

STRONG BUY RSSOFTWARE above 96 STOPLOSS 70 TARGET 150---200 (PURELY DELIVERY)


GRAPHICAL PRESENTATION:


macd divergance wxample char

TECHNICAL PRESENTATION:


Since start of the year 2015 stock has corrected from 300 level to low of 58 level in mid Jan 2016 where the counter has find some support level and from last 11 month the counter is consolidating in the price rage of 60 to 100 level. Further, the RSI Oscillator on weekly chart is indicating positive divergence from start of November month which is also coincide with MACD parameter too. So considering the above technical parameter on weekly chart we are advising our clients/Traders/Investors to but the stock after due diligence.


TVS ELECTRONICS LTD DAILY CHART

BUY TVSELECT ABOVE 176 STOPLOSS 150 TARGET 250---300 (PURELY DELIVERY )


GRAPHICAL PRESENTATION:


FOBONACCI RETRACEMENT EXAMPLE CHART

TECHNICAL PRESENTATION:


On daily chart, recently stock has given a sharp rally from 100 to 231 within just 14 trading session which is spectacular gain in-spite of market under performance due to demonetisation by Modi led NDA government. so if we draw an Retracement from 100 to 231 level, after touching recent new high now the stock is in profit booking mood and has taken an support at 38% retracement level which coincide at 177 on close basis. Thus we are again advising our clients to reenter if they have missed first upmove rally in this counter.


Friday, 11 November 2016

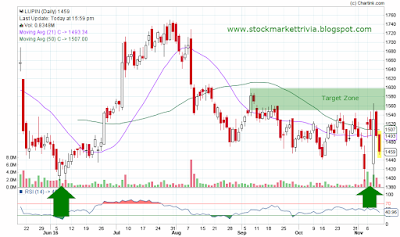
LUPIN DAILY CHART

Buy LUPIN 1480---1490  Stoploss 1420 Target 1600--1650 Duration- 4--7 Days

Graphical Presentation:

lupin daily chart analysis

Technical specification: Lupin on daily chart had formed a double bottom in recent last three trading session from where it has given strong up move with good support of rising volume above daily average so we can expect the upmove will get extend till the price hold level of 1520 on closing basis. Also on RSI parameter it is on rising upward above 50 level in coming days so there is still lot of upside is left on daily chart. So Traders & Investors are advised to trade as per there risk appetite after consulting his Financial Advisor.


Wednesday, 24 August 2016

Justdial Daily Retracement Analysis EOD

JUSTDIAL LTD


Buy Justdial 465---470  Stoploss  446  Target 554---621 Duration-2Months


retracement analysis chart example


Remarks: Justdial on daily chart had recently made a top of 904 in may month from where it is continuously sliding to downward and forming lower low and lower high pattern and is now in this month it is trying to consolidate for sometime after making a low of 446 in august this month and now it is showing some sign of retracement on upside. so if we calculate 23% retracement from high of 904 it comes to 554 and 38% retracement comes to 621 where this stock should go on upside in coming 2 months.

Wednesday, 4 May 2016

SBIN Daily Chart Gann Line Analysis

Technical Desk Call : 05 May 2016


Strong Buy SBIN 179---175  Stoploss CB 165  Target 189---205  Duration: 20 Days


SBIN daily Gann line analysis chart


Justification: SBIN on daily chart looking very weak from last seven trading session where it had been cooling off from 200 level till today also it has been closed in lower side at 179.95 on close. we are expecting this counter to get strong support in coming days around 165 on close basis. On Technical parameter if we plot a study called " GANN SPEED LINE " than the stock should found support around 179 to 175 in coming trading session and also we are predicting RSI indicator should also support the chart pattern around 30 value. 

Wednesday, 27 April 2016

NITESHEST DAILY CHART ANALYSIS

Technical Desk Call: 27Apr2016


Buy NITESHEST 14--14.50  Stoploss 11 CB  Target 22----25 Timeframe- 2Months


NITESHEST daily chart


Justification : The NITESHEST on daily chart today looked promising as the counter had witnessed huge buying interest with above average volume on daily chart. Also before bouncing back today the counter had exactly taken a support level at 89DMA yellow line and had faced minor resistance level at 200DMA green line, but we are of the view that in coming days the counter will easily surpassed this minor resistance of 14.50 level. RSI on daily chart is also looking positive till it maintain above 70 mark, so looking above technical setup we advised Investors/Traders to buy the stock with due diligence.