expr:class='"loading" + data:blog.mobileClass'> badge

Monday 3 June 2013

SKS Microfinance Ltd

Technical Desk Call - 03 June 2013

Strong Buy SKSMicro above 112.40 Stoploss 102 Target 124 + 129 + 134


sksmicro daily technical chart

Remarks :  The stock has given good healthier correction on recent past from 170 to 95 within period of three month so based on Fibonacci Retracement analysis we are of the view that now for time period stock has formed near term bottom around 95 level and the counter is ready for sharp pullback till 38 % retracement level which come around 125. Please read our disclaimer.

Wednesday 8 May 2013

HDIL

Housing Development & Infra. Ltd - (HDIL)

Technical Desk Call- 08May2013

Strong Buy HDIL above 56.50 Stoploss 52 Target 65+++69


hdil daily technical chart


Remarks: After analyzing above chart of HDIL on Daily chart is forming a Technical
Patter called "Cup & Soccer Pattern" which is a bullish candlestick pattern so we advised our traders or Investors or Blog Viewers to trade in this counter once it break its neckline above Rs. 56.50 with due diligence. Please read our disclaimer at http://stockmarkettrivia.blogspot.in/p/disclaimer.html

Wednesday 7 November 2012

Shree Ganesh Jewel-(SGJHL)

Technical Call Desk-07Nov2012

Strong Buy  SGJHL Above 125 Stoploss 115 Target 140+++145


sgjhl daily technical chart


Remarks: Based on above chart of SGJHL. it it clearly visible that stock has many time tried to cross above multi month high of 125 but it didn't able to give sustain closed above that which has happened today with decent support of volume, so we advised Tarders or Investors to trade with own due diligence.

Wednesday 17 October 2012

NILKAMAL

Technical Desk Call-18Oct2012

Strong Buy NILKAMAL above  251 StopLoss 238 Target 275


nilkamal daily technical chart

Remarks: Based on Price -Volume Pattern  on daily chart it is visible that NILKAMAL stock is on verge to breakout above its multi-month resistance of 250 with the support of spike in volume also so we advise Investors/Traders to follow above level with due diligence.


CMAHENDRA

Technical Desk Call-18Oct2012

Strong Buy CMAHENDRA above 101 StopLoss 99 Target 115-120

cmahendra daily technical chart


Remark: Based on Price-Volume Pattern analysis we are of the view that CMAHENDRA can easily sustain this rally up to a price of 120 before it pause its momentum for much deeper consolidation in long run. Also other supportive indicators like RSI and MACD is also improving which indicate much upside is still left in this counter, so we advise Investors/Traders to trade this counter with due diligence.

Friday 17 August 2012

GTOFFSHORE

Technical Desk Call-17Aug2012

Strong Buy GTOFFSHORE above 99 Stoploss 88 Target 111


gtoffshore daily technical chart

Remarks: Based on "Price-Volume Pattern" analysis we are of the view that GTOFFSHORE can easily sustain this rally upto price of 115-120 at-least before it pause its momentum for much deeper consolidation for higher target in short term., so we advise traders/investors to trade on stock with due diligence as above.

Wednesday 11 July 2012

RCOM

Technical Desk Call:11July2012

Strong Buy RCOM above 71.5 Stoploss 65 Target 80

rcom- inverted head and shoulder daily chart example

Remarks: The stock has given "Bullish- Inverted Head and Shoulder Pattern" breakout on daily chart with increasing volume in support so we infers from chart that the stock is heading toward 200 EMA i.e Rs. 80 which should be its first Target, but our Ultimate Pattern target is Rs. 90.


Tuesday 10 July 2012

ONMOBILE

Technical Desk Call:10July2012

Strong Buy ONMOBILE above 36.20 Stoploss 33.20 Target 42

onmobile daily volume chart example

Remark: Above Daily chart of ONMOBILE clearly shows huge spike in Volume from past 9 days so based on increasing volume with rise in stock price we recommend to Buy the stock mention as above.Please read our Disclaimer before investing or trading. 

Thursday 5 July 2012

SKSMICRO

Technical Desk Call : 5July2012

Strong Buy SKSMICRO only above Rs. 71 Stoploss 65 Target 79


sksmicrofinance daily chart analysis

Remark::: Above chart clearly shows strong technical pattern breakout i.e called as "Bullish 3 Method Formation" on daily charts with decent support of rising volume so based on this parameter we suggest to buy this stock with due diligence as above... please see our Disclosure.

Thursday 10 May 2012

FCH

Technical Desk Call- 11May2012                                                                               

Strong Buy FCH above 140 Target 150 Stoploss 134 

fch daily chart -volume analysis example

Note::: Stock has given good Technical breakout on daily chart with support of increasing volume from past one week which suggest some buying interest has emerge in the stock so based on this we suggest Investors/traders to buy this stock with due diligence. Please read our Disclaimer...


Wednesday 11 April 2012

Talwalkars

                                                  Technical Desk Call-11Apr2012

Strong Buy Talwalkars @ 181 StopLoss 165 Target 199-200 Timeframe 2 Weeks

talwalkars daily chart-volume analysis chart example

Note: Talwalkars Fitness is looking very strong on upside above Rs. 181 it has given clear-cut breakout on daily chart with huge volume i.e its 10days average volume is about just 1Lacs and from last two days its volume is above 3 to 5 Lacs so based on volume Indicator we advise Traders/Investors to Buy this stock with due diligence...Please read our disclaimer

Thursday 22 March 2012

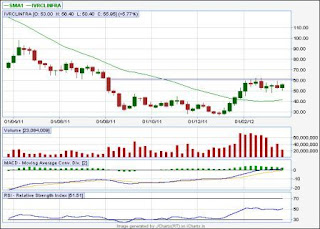
IVRCLINFRA

Technical Desk Call:::22March2012  

Strong Buy IVRCLINFRA above Rs. 60.15 StopLoss 55.90 Target 70 Timeframe 1 Week  

ivrclinfra daily chart-volume analysis example

Note: On weekly charts IVRCLINFRa is on a verge to give huge breakout with good amount of volume so we recommend Investors/Traders to buy this stock with due diligence..Please read our Disclaimer
                                              

Saturday 10 March 2012

HDIL

Technical Desk Call:::12March2012

Strong Buy HDIL above 106 StopLoss 100 Target 110++115 Timeframe 1week


Note: On daily chart HDIL has given flage pattern breakout so based on this we advise trader to take position as recommended above...please read our Disclaimer


Friday 24 February 2012

Provogue

Technical Desk Call::27Feb2012

Strong Buy PROVOGUE Above 36.20 Traget 40+++43 StopLoss 31.90 Timeframe 1 Weeks


Note:-  Stock hase given good Breakout on Daily Chart with Volume so we believe that on Monday if it Stays above Rs.36.20 for half and hour than we may see sharp rise on stock which may extend its movement till Rs.45......Read our Disclaimer

Monday 20 February 2012

RajOil

Technical Desk Call:: 21Feb2012


Strong Buy RAJOIL Above 16.25 Traget 18+++22.5 StopLoss 14.20 Timeframe 2 Weeks


P.S:We are strong buyer in this Scrip...Read Our Disclaimer...

GTL LTD

Technical Desk Call::16Feb2012

Buy GTLLTD Buy @ 51 Target 62+++69 Stop Loss 48 Timefrane 2 Weeks


P.S::Read Our Disclaimers

Sunday 19 February 2012

About Us


Dear Subscriber/Reader/Follower,

We at StockMarket Trivia believes in Long Term Investment potential of Indian Stock Market so with this belief we have started offering Stock Market Advisory service with product Portfolio ranging from..

  • Fundamental & Technical Stock Advisory
  •  Portfolio Advisory Service
  •  Mutual Fund Advisory
  •  Life Insurance(SBI Life)
  •  Health Insurance (MaxBupa), many more to come...


Business Moto:

  •      Always Be Flexible In Approach, As A Nature of Stock Market
  •          Always Try to Provide Education Before Investment, As "Education Is Best Investment"
  •           Always Try to Empower Customer, As Customer Is King of All Market


Visit Our Blog :

www.stockmarkettrivia.blogspot.com

Socialize Us:

Facebook: StockMarket Trivia
Google+ : StockMarket Trivia

Contact Us: 

(Office) ::: 02623-221146
(Email Us) ::: stockmarket.trivia@gmail.com