expr:class='"loading" + data:blog.mobileClass'> badge

Thursday, 5 November 2015

nifty and banknifty market outlook

Market Cues:

Indian markets are expected to open flat tracking SGX Nifty. U.S. stocks ended the Wednesday’s session slightly lower, taking a pause after two straight days of gains. Main indexes retreated as Fed Chairwoman Yellen hinted that a 25bp rate hike in December would not derail the economy or housing market. Notably, Energy and Consumer Discretionary were the biggest decliners. European stock markets rallied on Wednesday after ECB President Mario Draghi reiterated that bank is ready to provide more stimulus in December if required.

These gains trimmed after Janet Yellen hinted at rate hike possibility in Dec-2015. For FTSE 100, Glencore was the biggest gainer of the day as it reported significant progress on its plans to cut down the net debt by FY2016-end. Indian markets lost the previous day's gains on Wednesday’s trading session as benchmark indices fell marginally, despite the positive global cues. Indices started on a strong note, with Nifty trading above 8100-mark, but could not sustain gains in the afternoon trade as profit booking was seen across heavyweight stocks. Private sector bank, healthcare, technology and select oil stocks pulled the market lower.

 Sensex (26553) / Nifty (8040)

Yesterday, our benchmark index opened with nearly half a percent upside gap citing to cheerful mood across the globe. However, once again, the unsure bulls were overshadowed by the bears as we witnessed a decent correction throughout the session to close tad below the 8050 mark. As mentioned in our previous report, the index made an attempt move higher. However, similar to Tuesday's session, our markets faced a strong selling pressure at higher levels, which is not an encouraging sign. Despite this, we maintain our opinion that the index is likely to remain within a range of 200 points before confirming next direction of the market. On the higher side, 8120 – 8180 are likely to act as a strong resistance; whereas, 7950 is seen as a crucial support. Traders can focus on stock specific moves by following proper exit strategy.

Key Levels
Support 1 – 7995 Resistance 1 – 8120
Support 2 – 7950 Resistance 2 – 8180

 Bank Nifty Outlook - (17221)

Yesterday, the Bank Nifty opened with an upside gap of more than 100 points and started correcting from initial trades. The selling pressure was very sturdy as the index continued to make lower lows throughout the session. The banking index breached the low of last two sessions and eventually ended the session with a loss of 0.60 percent over its previous close. Going forward, a sustainable move below 17170 levels may drag the Bank Nifty towards 16930. On the flipside, the immediate resistance for the index is placed at 17466 and 17565 levels.

Key Levels
Support 1 – 17170 Resistance 1 – 17466
Support 2 – 16930 Resistance 2 – 17565
Wednesday, 4 November 2015

Sensex- Nifty Market Outlook

Sensex (26591) / Nifty (8061) 

Yesterday, our benchmark index opened slightly higher in-line with cheerful global bourses. However, the bulls failed to keep the momentum going as we witnessed a gradual slide within a narrow range to close tad above the 8050 mark. Monday’s recovery in the latter half led to a formation of ‘Dragonfly Doji’ pattern on the daily chart. As a result, the index started the session on a positive note however, the follow up buying was clearly missing. Despite this, we maintain our opinion that the index may still give a minor bounce back towards 8120 – 8180. Since, this can be termed as a pullback of the recent fall; we would advise not to trade aggressively on the long side. On the flipside, a sustainable move below 7950 may trigger pessimism in the market, which may result in a continuation of this downward move towards 7850 – 7800 levels. At this juncture, for next few days, we expect a range bound action within 200 points before confirming next direction of the market. Traders can focus on stock specific moves by following proper exit strategy.

Bank Nifty Outlook - (17326)

In yesterday's trading session,the Bank Nifty index traded in a narrow range and ended the session on a flat note. During last week, the index gave a breakdown from a rising trend line support with a gap down opening. As per the gap theory in technical analysis, the breakaway gap created last week should
now act as a resistance on pullback moves. The gap area seen last week is in a range of 17682 - 17738 and hence, we may see a pull back move towards the mentioned resistance zone in near term. Going forward, the intraday resistance for the index is placed at 17565 and 17682 levels. On the flip side, the immediate support in the index is placed around 17260 and 17170 levels.

Nifty :Key Levels
Support 1 – 7995 Resistance 1 – 8120
Support 2 – 7950 Resistance 2 – 8180

Bank Nifty:Key Levels
Support 1 – 17260 Resistance 1 – 17565
Support 2 – 17170 Resistance 2 – 17682

Wednesday, 12 August 2015

TATASTEEL


TECHNICAL DESK CALL : 12 AUG 2015


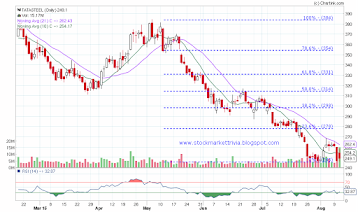
Positional Strong Buy Tatasteel above 255 Stoploss 245 Target 270---275

tatasteel chart with fibonacci analysis example
tatasteel daily chart- Fibonacci analysis example

Remarks: Tatasteel stock on daily chart looks interesting from the point of view of some consolidation is being done here in the range of 245 to 255. the stock had been in a deep correction from past 3 months from the high of 385 to low of 245 and now after its recent quarter result better than market expection we are of the view that this stock is poised to give some technical bounce back at least upto 285. so we advise traders and investors to look out for the stock with above given recommendation...
Read our disclaimers

Wednesday, 17 September 2014

Sesa Sterlite Ltd

Technical Desk Call : 18 Sep 2014

Positional Call - Strong Buy above 288 Target 295+++310 Stoploss 275


Flag Patern Breakout Chart Example-Stockmarket Trivia


Remarks: SSLT on daily chart is poised to give Flag Pattern Breakout once it surpass 295 resistance on the chart. from last one week the stock is in consolidation zone between 275-285 area and has stonge support at 273 (100DMA) which is good support for the counter in near term. RSI and MACD both the indicator suggest some momentum is expected on upside once this counter surpass its resistance level of 295. Advise traders and Investors to take position as per your risk appetite. Read our disclaimer 


Monday, 18 August 2014

Power Finance Corporation

Technical Desk Call : 08 Aug 2014

Positional Call -Strong Buy above 272.50 Stoploss 259 Target 288 


pfc Daily Technical Analysis

Remarks: PFC on daily chart looks pretty good for time being as it is now consolidating around 265 - 272. this counter has given healthy profit booking from its recent high of 344 to 256 low and now hovering around 270 level. if we plot retracement level on daily chart from its high level than 38% retracement level comes to 288 which we are expecting the counter to touch this level in coming days. we advise clients/traders or investors to trade after reading our disclaimer.


Tuesday, 21 January 2014

TATASTEEL

TECHNICAL DESK CALL: 21 Jan 2014

Positional Strong Buy TATASTEEL (FUT) CMP 383.50 Stoploss 374 Target 395


Technical analysis of tatasteel daily chart


Remarks: Tatasteel on daily chart looks attractive for the time being as we draw retracement theory on daily chart from recent high of 435 to low 370.....38% retracement comes at 395 so we advise traders/investors to trade for this target with all due diligence...

Monday, 20 January 2014

HINDUNILVR

TECHNICAL DESK CALL: 20 JAN 2014

Positional Strong Buy HINDUNILVR (FUT) cmp 560 Stoploss 538 Target 580+++601

Technical chart of hindunilvr


Remarks : Hindunilvr on daily charts looks attractive from the point of view of dad cat bounce as it has been from past many period it is under performing the market  and had corrected from September months high of around 685 to 538 recently mad low so from that point it is now making some consolidation before it slip any further on downside we are expecting the stock to touch 38% retracement level i.e. 594....please read our disclaimer

Monday, 2 December 2013

Karnataka Bank

Technical Desk Call : 20 Dec2013

Positional Buy KTKBANK Above 103 Stoploss 98 Target 112


Ascending Triangle Pattern Chart Example


Remarks: KTKBANK on daily chart had given Ascending Triangle Pattern breakout above 103 level and also has been able to give Two consecutive close above this level so we are of the view that the counter is ready to touch much higher level of atleast 112 where it can phase a stiff resistance and pause for a while...read our disclaimer first before investing. 

Wednesday, 9 October 2013

L&T Finance Holding

Technical Desk Call: 07 Oct 2013

Positional Buy L&TFH above 72.80 Stoploss 64 Target 85+++90


L&TFH daily chart breakout-Cup & Soccer pattern

Remarks: L&TFH on daily chart had given Cup & Soccer pattern breakout with spike in volume which is above its 10D average volume and also the counter from past many days has been trying to consolidate in a narrow range and finally now it has given breakout on upper side above 72 level so we advise traders or investors to trade as per above mention level...  

Friday, 6 September 2013

L&T Finance & Holding

Technical Desk Call: 06 Sep 2013

Strong Buy L&TFH above 61 Stoploss 54 Target 72+++78


L&TFH Daily Chart

Remarks: L&TFH on daily chart has give good breakout on closing based with good spike in volume from  last one quarter so based on Volume Analysis our technical team is of the view that the counter is on a strong upmove for short term target of 78 and ultimate target of much higher level (Disclosed to Clients only) in coming days.

Friday, 23 August 2013

HATHWAY CABLE

Technical Desk Call:23Aug2013

Strong Buy HATHWAY above 272 Stoploss 262 Target 285+++290


hathway cable technical chart

Remarks: Hathway cable on daily chart has given good jump from 235 to 275 in week and from last 5 days it is in a consolidation mode before it gave good breakout above 272 on today's trading session with below average volume but we are on the view that above these level the counter will definitely generate buying momentum upto 290. Read our disclaimer 

Tuesday, 13 August 2013

HINDZINC

Technical Desk Call - 08Aug2013

Strong Buy HINDZINC above 102 Stoploss 97 Target 112


hindzinc daily chart

Remark: Hindzinc on daily chart looks good and we are anticipating this counter to form 'W' pattern and also it has given good breakout from its sloping downtrend trend-line and the counter is sustaing above this trend-line so our research team is of the view that it should easily cross our target zone area of 110-112 in coming days. 


Friday, 26 July 2013

SKSMICRO

Technical Desk Call - 26July2013

Strong Buy SKSMICRO above 110 Stoploss 102 Target 119 +++ 126


sksmicro daily technical chart


Remarks: SKSMICRO on daily chart looks good and we are anticipating the counter to bottomed out around 102 to 105 level which it is holding since last quarter and today the counter has given good breakout on upside with huge volume and had also delivered good quarter result so we are of the view that on coming days we are expecting the stock price to go 125 to 140 level in a month time period. Read our disclaimer.


Monday, 15 July 2013

HDIL

Technical Desk Call : 15July2013

Strong Buy HDIL above 41 Stoploss 39 Target 46


hdil daily technical chart


Remarks: HDIL on daily chart is poised to give Triangle Pattern breakout above 41 which can lead counter to much higher level in coming days also RSI momentum is on positive side so we advised our Readers,Followers or Investors to take position as per your risk appetite. Please read our disclaimer.

Monday, 8 July 2013

RPOWER

Technical Desk Call-08July2013

Strong Buy RPOWER above 71.50 Stoploss 66 Target 79


rpower daily technical chart

Remarks: Today on daily chart rpower has given good breakout with spike in volume and also RSI is in positive zone so we advise readers/traders/investors to buy this counter with above mention level.Read our disclaimers


Friday, 5 July 2013

Buffettlogy

Look at stocks as business, look for businesses you understand,
                              run by people you trust and are comfortable with,
         
          and leave them alone for a long time.         

                                             -Warren Buffet

investing quotes by warren buffet

Tuesday, 18 June 2013

News Delhi Television Ltd

Technical Desk Call - 18June2013

Strong Buy NDTV above 91 Stoploss 84 Target 97 - 99


ndtv technical daily chart


Remarks : The counter has given good decisive breakout on daily chart with huge volume which is almost four times of its last 10D average volume on daily chart so based on Volume indicator we are of the view that stock should easily move above 91 level with target price in range of 97 to 99 where it may find some resistance level to give sustain movement for higher upside in longer time period. 


Advertisement


Monday, 3 June 2013

SKS Microfinance Ltd

Technical Desk Call - 03 June 2013

Strong Buy SKSMicro above 112.40 Stoploss 102 Target 124 + 129 + 134


sksmicro daily technical chart

Remarks :  The stock has given good healthier correction on recent past from 170 to 95 within period of three month so based on Fibonacci Retracement analysis we are of the view that now for time period stock has formed near term bottom around 95 level and the counter is ready for sharp pullback till 38 % retracement level which come around 125. Please read our disclaimer.

Wednesday, 8 May 2013

HDIL

Housing Development & Infra. Ltd - (HDIL)

Technical Desk Call- 08May2013

Strong Buy HDIL above 56.50 Stoploss 52 Target 65+++69


hdil daily technical chart


Remarks: After analyzing above chart of HDIL on Daily chart is forming a Technical
Patter called "Cup & Soccer Pattern" which is a bullish candlestick pattern so we advised our traders or Investors or Blog Viewers to trade in this counter once it break its neckline above Rs. 56.50 with due diligence. Please read our disclaimer at http://stockmarkettrivia.blogspot.in/p/disclaimer.html

Wednesday, 7 November 2012

Shree Ganesh Jewel-(SGJHL)

Technical Call Desk-07Nov2012

Strong Buy  SGJHL Above 125 Stoploss 115 Target 140+++145


sgjhl daily technical chart


Remarks: Based on above chart of SGJHL. it it clearly visible that stock has many time tried to cross above multi month high of 125 but it didn't able to give sustain closed above that which has happened today with decent support of volume, so we advised Tarders or Investors to trade with own due diligence.