expr:class='"loading" + data:blog.mobileClass'> badge

Tuesday 3 July 2018

ONGC Daily Chart Analysis

Short Term Delivery Call


ONGC Strong Buy Above 161 Stoploss 149 Target 167---175---190


Graphical Presentation :


ongc daily chart analysis


Technical Presentation : 

On Daily chart the counter had been in a very deep correction from january 2018 till date. If we draw a fibonacci Retracement from recent low of 151.80 (52W Low) to recent top of 212 (52W High) than 38% retracement come at 175 which should be touch in coming days as per the study if it hold the low price. Also the counter has today tried to breakout from downward trendline resistance of 161 but it got failed to give close above it but looking to today's volume we can presume that in coming days it should resume its upward movement and should give bounce back to our suggested target zone.

Sunday 31 December 2017

IBVENTURE daily Chart Analysis

Short Term Delivery Call


IBVENTURE 

Strong Buy Above 410  Stoploss 389  Target 425---445---515

Graphical Presentation : 

ibventure daily chart analysis


Technical Presentation : 

On Daily chart the counter had been in a very deep correction from September 2018 till date. If we draw a Fibonacci Retracement from recent low of 324 to recent top of 819 than 38% Retracement come at 513 which should be touch in coming days as per the study if it hold the low price. Also the counter has recently this week tried to breakout from bottom level with increase in volume so we can presume that in coming days it should resume its upward movement and should give bounce back to our suggested target zone.

Monday 31 July 2017

Cochin Shipyard IPO: Apply or Ignore?


COCHIN IPO

Background:

Cochin Shipyard is a Government owned shipbuilding and ship repair company which was established in 1972. It enjoys  the Miniratna status and as its name suggests, is based out of Kochi in Kerala. It is the largest public sector shipyard in India.

Business & Clients:

  • The company undertakes both defence and commercial orders
  • Defence accounts for nearly 80% of the revenues
  • Shipbuilding makes up ~ 80% of the revenues and the balance 20% comes from ship repairs
  • Indian Navy and Indian Coast Guards make up 85% of the revenues
  • The company is building India’s first IAC (Indigenous Aircraft Carrier)

There is a high client concentration risk and the defence sector is totally at the mercy of the Government

Future Prospects:

The company is enroute to build another IAC and also diversify into LNG Carriers (License obtained). Since most of the business comes from the defence sector, the company’s fortunes are tied up to the defence sector policies of the Government. We, as a firm policy, don’t predict and forecast Government policies.
The company currently has a healthy order book of ~ Rs 3,070 Crores which is nearly 1.4x of its FY17 revenues. The company’s CMD said that they turn down 20-30 vessels for repairs in a year due to lack of capacity. IPO proceeds will be utilized for capacity expansion by building a new dry dock and also by setting up a new ship repair facility.

The company is cash rich (Rs 1,600 crores of cash). It is further raising funds amounting to Rs 1,443 crores by the IPO route. The planned capex is Rs 2,800 crores which spreads over to FY23.

Financials:

  • The company has grown its revenues at a CAGR of 7.95% between FY12 and FY17
  • The company has grown its PAT at a CAGR of 15.75% between FY12 and FY17
  • The company has demonstrated pricing power by expanding margins
  • Other income makes up nearly 1/3rd of the EPS

Valuations:

At Rs 432, the market capitalization works out to ~ Rs 5,900 crores and the PE multiple 18.32x FY17 reported PAT. The company operates in a sector which has seen most companies crumble to debt (ABG Shipyard, Reliance, Bharti, etc.). However, Cochin Shipyard has stayed away from taking debt in its balance sheet and has remained profitable.
The company is well poised to benefit from its strong execution skills and steady order flow from the Government. It is operating in a cyclical business and there will be rough times in between.

The allotment price for retail shareholders will be ~ Rs 411 (Rs 432 with a 5% discount). The company has a book value of Rs 179 per share and a cash per share value of Rs 165 which offers a decent margin of safety.

Apply or Ignore:

Apply for the IPO with only 1 lot under one name as the issue will be oversubscribed and allotment at the most will be for a single lot. IPO market is generating a lot of buzz and one can expect a around 25% listing day gain from this IPO.


Disclaimer : Source - www.raghavbehani.com

Friday 24 February 2017

Avenue Supermart (D-Mart) IPO Analysis

D-Mart IPO- King of Retail


IPO analysis, dmart ipo

Since the days of Harshad Mehta, RadhaKrishna Damani is known to be the man of Midas touch. He is the big Bull Rakesh Jhunjhunwala’s Guru and a Ace Investor.

RadhaKrishna Damani started his own venture D-mart Retail 17 years back in 2000 and D-Mart is expected to be listed at 18,000 Crores of Valuation next month. The Current Grey Market Premium on this issue is 50% or 150 per share,In next 3 mins, you will definitely learn what makes D-mart so special.

Introduction to D-Mart – D Mart is third largest in the sector after Reliance Retail and Kishore Biyani’s Future Group. D Mart is one of the few profit making grocery retailers, known for low-priced products and a low-cost business model. 53% of D-Marts revenue comes from Food, 21% from FMCG and 26% General Merchandise and Apparel. Business model is easy i.e. to retail quality goods at competitive prices. The majority of products stocked by them are everyday products forming part of basic rather than discretionary spending. D-Mart had 112 Stores at End of FY2016 with presence in 8 States and 41 cities, Maharashtra contributed 63% of revenue whereas Gujarat contributes 19%.

Why is D-Mart so Successful? (Moat Around the Business)


dmart business philosophy


#Factor 1- Ownership of all Properties – Avenue Supermarts currently owns all its properties which eliminates rental cost. Rental costs typically account ~ 3 % – 8% for peers.  It operates predominantly on an ownership model (including long-term lease arrangements, where lease period is more than 30 years and the building is owned by it) rather than on a rental model.


#Factor 2- Revenue Per Square Feet –  This is the real big difference between a great business and a mediocre one. A Great business sweats its assets a lot more than the mediocre one. D-mart, Reliance Retail and Future Retail (Big Bazaar) have broadly the same product portfolio but D-mart does sales of 28,136 per Sq. feet whereas Reliance and Future do half of that at 13,901 Per Sq Feet and 12,914 Respectively.


#Factor 3 – Inventory Turnover – If there was one Ratio that we could have looked at and judged a Retail franchise, that would be Inventory Turnover. D-mart kills competition here, its like the Zara of FMCG Retail.  D-mart Inventory Turnover is 14.18 (26 days) v/s 4.9x (75 Days) for Future Retail.


#Factor 4 – Shift from Unorganized to Organized – We expect a very large shift from unorganized sector to organized sector, Organized retail is expected to grow at 21% whereas unorganized retail is expected to grow at 11.7%. We believe post GST, the pace of shift from unorganized to organized will be faster which will benefit D-Mart.


#Factor 5 – Growth led by Same Store Growth Plus Expansion – D-Mart’s Same store growth in last 3 years has been an astonishing with 26%, 22% and 21% for FY 2014,2015, and 2016. They plan to add 2.1 Million Square feet or about 70 new stores by 2020 (Assuming every story is 30-35k Sq Feet). D-mart has been the fastest growing retailer and increased revenues from 2200 Crores in 2012 to 8,600 crores in 2016


#Factor 6 – Gross Margins – D-mart has the lowest Gross margin among all Players and still has the highest operating margin, making it a Moat. In a commodity business, the most efficient player wins, D-mart has show how selling its goods with economies of scale makes a it superb business model. D-Marts Gross margins are only 52% whereas Future Group its 65%, showing D-mart is passing the cost benefit to its customers and selling it cheaper than peers which ensures higher revenue per sq. feet.


#Factor 7 – Employee Cost – D-Mart has the Least number of Employees per square foot i.e. 1 employee for 800 Square feet whereas competitors have 1 employee for every 400-500 Sq. Feet (you don’t need someone to help you buy Maggi, do you?).  This makes D-mart far more efficient compared to competition.

#Factor 8 – Return on Equity – By now i am sure you understood D-mart’s business model,You might be thinking that D-mart is a asset heavy business as it doesn’t rent properties rather it buys them, but D-mart has shown that even after having a very heavy asset base it has managed to deliver 20%+ Return on equity.

#Factor 9 – Comparison with Global Peers – D-Marts model is similar to that of Walmart, with a lot of owned stores, very high inventory turnover and low debt on balance sheet.Costco a members only wholesaler which has created immense value in last decade also a model of Economies of Scale. Zara and Walmart have proven that the only way to great value in retail is sell cheap and increase your Inventory turnover.


Stallion’s View – D-Mart is a Consumer facing business who has cost leadership as it pays all his suppliers within 15 days against a cash discount, passes this cost benefit to customers with lowest gross margins in the Industry at 52%. D-Mart has been Smart with its cost management compared to its peers, and even after being a asset heavy business model its ROE is more than 20%+ .D- Mart is Expected to come with a Valuation of 18,000 or about 40x FY2017 PE. D-mart has a strong Business model, Longevity and Growth on its side. The organized Retail is expected to grow at 21% for next 10 years, which ensures D-Mart won’t trade at cheap valuations for a long long time.

We Recommend a Subscribe on Avenue Supermart IPO (D-mart) and Believe it will list at 400/Share plus atleast.

Report by Stallion Asset on D-Mart

Tuesday 27 December 2016

RSSOFTWARE WEEKLY CHART

STRONG BUY RSSOFTWARE above 96 STOPLOSS 70 TARGET 150---200 (PURELY DELIVERY)


GRAPHICAL PRESENTATION:


macd divergance wxample char

TECHNICAL PRESENTATION:


Since start of the year 2015 stock has corrected from 300 level to low of 58 level in mid Jan 2016 where the counter has find some support level and from last 11 month the counter is consolidating in the price rage of 60 to 100 level. Further, the RSI Oscillator on weekly chart is indicating positive divergence from start of November month which is also coincide with MACD parameter too. So considering the above technical parameter on weekly chart we are advising our clients/Traders/Investors to but the stock after due diligence.


TVS ELECTRONICS LTD DAILY CHART

BUY TVSELECT ABOVE 176 STOPLOSS 150 TARGET 250---300 (PURELY DELIVERY )


GRAPHICAL PRESENTATION:


FOBONACCI RETRACEMENT EXAMPLE CHART

TECHNICAL PRESENTATION:


On daily chart, recently stock has given a sharp rally from 100 to 231 within just 14 trading session which is spectacular gain in-spite of market under performance due to demonetisation by Modi led NDA government. so if we draw an Retracement from 100 to 231 level, after touching recent new high now the stock is in profit booking mood and has taken an support at 38% retracement level which coincide at 177 on close basis. Thus we are again advising our clients to reenter if they have missed first upmove rally in this counter.


Friday 11 November 2016

LUPIN DAILY CHART

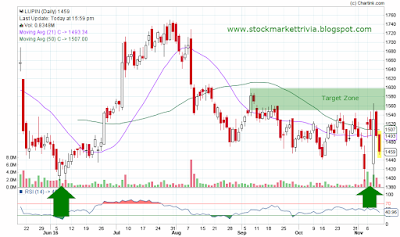
Buy LUPIN 1480---1490  Stoploss 1420 Target 1600--1650 Duration- 4--7 Days

Graphical Presentation:

lupin daily chart analysis

Technical specification: Lupin on daily chart had formed a double bottom in recent last three trading session from where it has given strong up move with good support of rising volume above daily average so we can expect the upmove will get extend till the price hold level of 1520 on closing basis. Also on RSI parameter it is on rising upward above 50 level in coming days so there is still lot of upside is left on daily chart. So Traders & Investors are advised to trade as per there risk appetite after consulting his Financial Advisor.


Wednesday 24 August 2016

Justdial Daily Retracement Analysis EOD

JUSTDIAL LTD


Buy Justdial 465---470  Stoploss  446  Target 554---621 Duration-2Months


retracement analysis chart example


Remarks: Justdial on daily chart had recently made a top of 904 in may month from where it is continuously sliding to downward and forming lower low and lower high pattern and is now in this month it is trying to consolidate for sometime after making a low of 446 in august this month and now it is showing some sign of retracement on upside. so if we calculate 23% retracement from high of 904 it comes to 554 and 38% retracement comes to 621 where this stock should go on upside in coming 2 months.

Wednesday 4 May 2016

SBIN Daily Chart Gann Line Analysis

Technical Desk Call : 05 May 2016


Strong Buy SBIN 179---175  Stoploss CB 165  Target 189---205  Duration: 20 Days


SBIN daily Gann line analysis chart


Justification: SBIN on daily chart looking very weak from last seven trading session where it had been cooling off from 200 level till today also it has been closed in lower side at 179.95 on close. we are expecting this counter to get strong support in coming days around 165 on close basis. On Technical parameter if we plot a study called " GANN SPEED LINE " than the stock should found support around 179 to 175 in coming trading session and also we are predicting RSI indicator should also support the chart pattern around 30 value. 

Wednesday 27 April 2016

NITESHEST DAILY CHART ANALYSIS

Technical Desk Call: 27Apr2016


Buy NITESHEST 14--14.50  Stoploss 11 CB  Target 22----25 Timeframe- 2Months


NITESHEST daily chart


Justification : The NITESHEST on daily chart today looked promising as the counter had witnessed huge buying interest with above average volume on daily chart. Also before bouncing back today the counter had exactly taken a support level at 89DMA yellow line and had faced minor resistance level at 200DMA green line, but we are of the view that in coming days the counter will easily surpassed this minor resistance of 14.50 level. RSI on daily chart is also looking positive till it maintain above 70 mark, so looking above technical setup we advised Investors/Traders to buy the stock with due diligence.

Monday 28 March 2016

TATASTEEL DAILY CHART ANALYSIS

Technical Desk Call: 28March2016 

Future Strategy:

Sell TataSteel Fut(Apr) 311---310  Stoploss 322 CB Target 281---271 Time-frame 10---14Days

 Option Strategy :

Buy Tatasteel 280 Put (Apr) 3--4    Stoploss Rs. 1  Target 10--12


Justification:  The stock has seen a sharp rally in current march series from its latest double bottom range 210-220 till today's high of 218 which was almost double top formation on daily chart. At current juncture, the stock bottomed out from 210 level to sharply bounced till 318 which on retracement chart if we see than today it has faced a stiff resistance level around 320 level on closing basis and had sharply corrected as expected which suggest some profit booking to emerged till level of 280---270 where again a stock can consolidate for some time. 

At the same time, we are also observing a strong resistance and overbought indication on RSI and a negative divergence on MACD on daily chart which suggest some reversal on card. So considering current chart structure, we believe that this recent up move was mere a pull back of sharp fall in the counter of the past and thus we are again expecting some selling pressure to emerged again in this counter. Hence traders are advised to take short position as shown above.

Friday 6 November 2015

Diwali Muhurat Trading Picks-2015

Dear SMTians,

1. SUZLON ENERGY @CMP 21.50--22  Target 45---50 Timeframe Dec2016

2. RelComm @CMP 76--78 Target 125---150 Timeframe Dec2016

3. State Bank of India @CMP 242--244 Target 400 Timeframe Dec2016

4. RECLTD @CMP 238--240 Target 400 Timeframe Dec2016

5. HDIL @CMP 67--68 Target 125 Timeframe Dec2016

6. IRB Infra @CMP 238--240 Target 400 Timeframe Dec2016

7. JUSTDIAL @CMP 760--770 Target 1800 Timeframe Dec2016

8. ABAN OFFSHORE @CMP 218--222 Target 500 Timeframe Dec2016

9. TVSMOTORS @CMP 282--285 Target 500 Timeframe Dec2016

10. ONMOBILE @CMP 95--96 Target 200 Timeframe Dec2016


Remarks:: Dear Traders/Investors please consent your financial adviser before taking any disciplinary action based on above recommendation. we or the owner of this blog will not be held liable for any financial loss incurred by the investor or traders. The owner of the blog is not the SEBI registered RA (Research Analyst). Please read our full disclaimer on the blog.

sensex-nifty market outlook

Market Cues :

Indian markets are expected to open in green tracking SGX Nifty & Asian peers. U.S. stocks ended Thursday’s session modestly lower for second consecutive day, as investors turned cautious ahead of an important employment report due on Friday. Key indexes swung between small gains and losses before ending the day slightly lower, as investors were weighing a possible rate hike in December, 2015. Notably, Energy, Utilities and Materials were the biggest decliners. European stock ended the day in red, as the pound dropped after Bank of England gave a downcast outlook for the British economy, saying that weakness in emerging markets will drag on the growth and inflation prospects. Poor quarterly earnings led to correction across the Wm. Morrison Supermarkets and Randgold Resources stocks on Thursday. Indian markets ended the day in red for second consecutive trading session. With outcome of Bihar Exit polls later in the evening, investors turned cautious. Key indices witnessed correction in the afternoon trade and they closed 1% lower.

Sensex (26304) / Nifty (7955)

We had a soft opening yesterday mainly on the back of mixed global cues. Subsequently, the benchmark index kept on falling throughout the session to close with a percent cut. Quite surprisingly to most of the traders (including us), we witnessed extremely weak session and as a result, the Nifty eventually slipped below the 8000 mark for the first time in last four weeks. Cosidering yesterday's session, it seems that the bulls are opting to stay out of the market just ahead of Bihar election result. Technically speaking, the Nifty has now broken down marginally from its lower end of the Channel. Going forward, if the index manages to stay below 7920 then we may witness an immediate correction towards 7850 - 7800 levels. On the higher side, 8020 – 8060 are likely to act as a strong resistance. It's advisable to stay light on positions as the election outcome on Monday may bring in higher volatility in our market.

Key Levels
Support 1 – 7920 Resistance 1 – 8020
Support 2 – 7850 Resistance 2 – 8060

 Bank Nifty Outlook - (16995)


In yesterday's trading session, the Bank Nifty index witnessed another gap down opening and continued its negative momentum throughout the session before ending the day with losses of 1.31%. As we have mentioned in our previous report, the breach of crucial support levels of 17170 with gaps indicates resumption of the corrective down move. The index is now approaching its next support level of 16888 which is 50% retracement of the previous upmove. The index may give a minor pullback move from the mentioned support; but, the broader trend will continue to be negative unless the prices show any reversal signs. The immediate support for BankNifty index are placed around 16888 and 16620 whereas resistances are seen around 17200 and 17475.

Key Levels
Support 1 – 16888 Resistance 1 – 17200
Support 2 – 16620 Resistance 2 – 17475

Thursday 5 November 2015

nifty and banknifty market outlook

Market Cues:

Indian markets are expected to open flat tracking SGX Nifty. U.S. stocks ended the Wednesday’s session slightly lower, taking a pause after two straight days of gains. Main indexes retreated as Fed Chairwoman Yellen hinted that a 25bp rate hike in December would not derail the economy or housing market. Notably, Energy and Consumer Discretionary were the biggest decliners. European stock markets rallied on Wednesday after ECB President Mario Draghi reiterated that bank is ready to provide more stimulus in December if required.

These gains trimmed after Janet Yellen hinted at rate hike possibility in Dec-2015. For FTSE 100, Glencore was the biggest gainer of the day as it reported significant progress on its plans to cut down the net debt by FY2016-end. Indian markets lost the previous day's gains on Wednesday’s trading session as benchmark indices fell marginally, despite the positive global cues. Indices started on a strong note, with Nifty trading above 8100-mark, but could not sustain gains in the afternoon trade as profit booking was seen across heavyweight stocks. Private sector bank, healthcare, technology and select oil stocks pulled the market lower.

 Sensex (26553) / Nifty (8040)

Yesterday, our benchmark index opened with nearly half a percent upside gap citing to cheerful mood across the globe. However, once again, the unsure bulls were overshadowed by the bears as we witnessed a decent correction throughout the session to close tad below the 8050 mark. As mentioned in our previous report, the index made an attempt move higher. However, similar to Tuesday's session, our markets faced a strong selling pressure at higher levels, which is not an encouraging sign. Despite this, we maintain our opinion that the index is likely to remain within a range of 200 points before confirming next direction of the market. On the higher side, 8120 – 8180 are likely to act as a strong resistance; whereas, 7950 is seen as a crucial support. Traders can focus on stock specific moves by following proper exit strategy.

Key Levels
Support 1 – 7995 Resistance 1 – 8120
Support 2 – 7950 Resistance 2 – 8180

 Bank Nifty Outlook - (17221)

Yesterday, the Bank Nifty opened with an upside gap of more than 100 points and started correcting from initial trades. The selling pressure was very sturdy as the index continued to make lower lows throughout the session. The banking index breached the low of last two sessions and eventually ended the session with a loss of 0.60 percent over its previous close. Going forward, a sustainable move below 17170 levels may drag the Bank Nifty towards 16930. On the flipside, the immediate resistance for the index is placed at 17466 and 17565 levels.

Key Levels
Support 1 – 17170 Resistance 1 – 17466
Support 2 – 16930 Resistance 2 – 17565

Wednesday 4 November 2015

Sensex- Nifty Market Outlook

Sensex (26591) / Nifty (8061) 

Yesterday, our benchmark index opened slightly higher in-line with cheerful global bourses. However, the bulls failed to keep the momentum going as we witnessed a gradual slide within a narrow range to close tad above the 8050 mark. Monday’s recovery in the latter half led to a formation of ‘Dragonfly Doji’ pattern on the daily chart. As a result, the index started the session on a positive note however, the follow up buying was clearly missing. Despite this, we maintain our opinion that the index may still give a minor bounce back towards 8120 – 8180. Since, this can be termed as a pullback of the recent fall; we would advise not to trade aggressively on the long side. On the flipside, a sustainable move below 7950 may trigger pessimism in the market, which may result in a continuation of this downward move towards 7850 – 7800 levels. At this juncture, for next few days, we expect a range bound action within 200 points before confirming next direction of the market. Traders can focus on stock specific moves by following proper exit strategy.

Bank Nifty Outlook - (17326)

In yesterday's trading session,the Bank Nifty index traded in a narrow range and ended the session on a flat note. During last week, the index gave a breakdown from a rising trend line support with a gap down opening. As per the gap theory in technical analysis, the breakaway gap created last week should
now act as a resistance on pullback moves. The gap area seen last week is in a range of 17682 - 17738 and hence, we may see a pull back move towards the mentioned resistance zone in near term. Going forward, the intraday resistance for the index is placed at 17565 and 17682 levels. On the flip side, the immediate support in the index is placed around 17260 and 17170 levels.

Nifty :Key Levels
Support 1 – 7995 Resistance 1 – 8120
Support 2 – 7950 Resistance 2 – 8180

Bank Nifty:Key Levels
Support 1 – 17260 Resistance 1 – 17565
Support 2 – 17170 Resistance 2 – 17682

Wednesday 12 August 2015

TATASTEEL


TECHNICAL DESK CALL : 12 AUG 2015


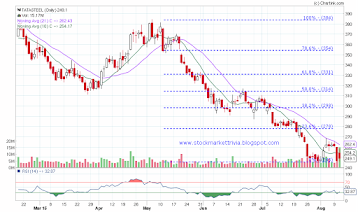
Positional Strong Buy Tatasteel above 255 Stoploss 245 Target 270---275

tatasteel chart with fibonacci analysis example
tatasteel daily chart- Fibonacci analysis example

Remarks: Tatasteel stock on daily chart looks interesting from the point of view of some consolidation is being done here in the range of 245 to 255. the stock had been in a deep correction from past 3 months from the high of 385 to low of 245 and now after its recent quarter result better than market expection we are of the view that this stock is poised to give some technical bounce back at least upto 285. so we advise traders and investors to look out for the stock with above given recommendation...
Read our disclaimers

Wednesday 17 September 2014

Sesa Sterlite Ltd

Technical Desk Call : 18 Sep 2014

Positional Call - Strong Buy above 288 Target 295+++310 Stoploss 275


Flag Patern Breakout Chart Example-Stockmarket Trivia


Remarks: SSLT on daily chart is poised to give Flag Pattern Breakout once it surpass 295 resistance on the chart. from last one week the stock is in consolidation zone between 275-285 area and has stonge support at 273 (100DMA) which is good support for the counter in near term. RSI and MACD both the indicator suggest some momentum is expected on upside once this counter surpass its resistance level of 295. Advise traders and Investors to take position as per your risk appetite. Read our disclaimer 


Monday 18 August 2014

Power Finance Corporation

Technical Desk Call : 08 Aug 2014

Positional Call -Strong Buy above 272.50 Stoploss 259 Target 288 


pfc Daily Technical Analysis

Remarks: PFC on daily chart looks pretty good for time being as it is now consolidating around 265 - 272. this counter has given healthy profit booking from its recent high of 344 to 256 low and now hovering around 270 level. if we plot retracement level on daily chart from its high level than 38% retracement level comes to 288 which we are expecting the counter to touch this level in coming days. we advise clients/traders or investors to trade after reading our disclaimer.


Tuesday 21 January 2014

TATASTEEL

TECHNICAL DESK CALL: 21 Jan 2014

Positional Strong Buy TATASTEEL (FUT) CMP 383.50 Stoploss 374 Target 395


Technical analysis of tatasteel daily chart


Remarks: Tatasteel on daily chart looks attractive for the time being as we draw retracement theory on daily chart from recent high of 435 to low 370.....38% retracement comes at 395 so we advise traders/investors to trade for this target with all due diligence...

Monday 20 January 2014

HINDUNILVR

TECHNICAL DESK CALL: 20 JAN 2014

Positional Strong Buy HINDUNILVR (FUT) cmp 560 Stoploss 538 Target 580+++601

Technical chart of hindunilvr


Remarks : Hindunilvr on daily charts looks attractive from the point of view of dad cat bounce as it has been from past many period it is under performing the market  and had corrected from September months high of around 685 to 538 recently mad low so from that point it is now making some consolidation before it slip any further on downside we are expecting the stock to touch 38% retracement level i.e. 594....please read our disclaimer